There is a lot of discussion in Oakland about Charter schools, we have 42 charter schools in Oakland (approved by both OUSD and the County Office of Education), and charter students represent 30% of all students enrolled district or charter schools, more than any other district in the state. That heavy concentration comes with a cost – $57 million according to a recent ITPI report. But it’s not just about a dollar amount, it’s also about serving kids, all kids, regardless of what kind of services they might need. That is what a public school does.

So we wondered, what would it look like if we compared the student populations of two schools that are co-located on one campus? It’s not always easy to find two schools, of the same grade levels, in the same neighborhood, but we have that “apples to apples” comparison in deep East Oakland, in a neighborhood that has suffered from generations of disinvestment and deep trauma. How would the students at these two high schools, one district, one charter, be the same, or different?
The District school is bigger, but not that big for a comprehensive high school – 860 compared to 420 for the Charter school. They both have about the same percentage of students receiving Free or Reduced Price Lunch, about 92%. The District school serves twice as many Latinx as African-American students, with a sprinkling of other demographic groups, but not many. Why then is the Charter school in this same neighborhood made up of more than 90% Latinx but just 6.6% African-American students?
Oakland has many students that have very specialized needs, including special education, unhoused students, newcomers and English learners. These students need critical, and often more costly, services that a public school must provide, should provide in order to educate the whole child. And in the case of our co-located schools, the District school has a larger percentage of these students in every single category.
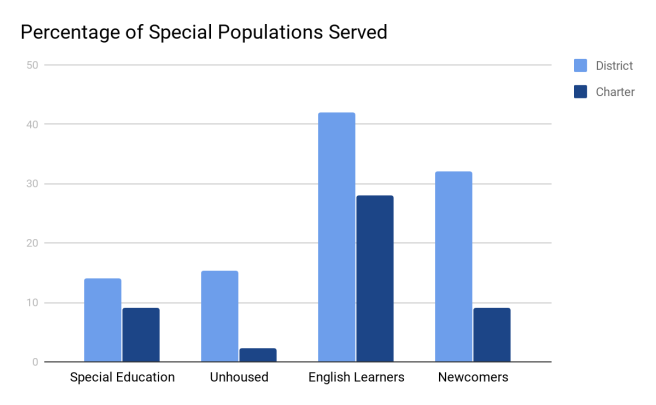
Special education: District school 14%, Charter school 9%; Unhoused students: District school 15.28%, Charter school 2.2%; English Learners: District school 43%, Charter school 28%; Newcomers: District school 32% (estimated from current enrollment information); Charter school 9%
The leader of a local Charter Advocacy group looked at this data and said:
This is who those schools house. Look at the dashboard for performance. I can 100% guarantee you that the charter outperforms across the board. It does. Especially with grad rates. You can make the argument that all of those district kids would be better served in the charter.
The point wasn’t about performance, it was about who is (or is not) being educated in those schools. Instead of acknowledging that, recognizing the impact on OUSD schools of concentrating the highest need students in the District, recognizing that outcomes can be stymied by the under-resourcing of schools this concentration causes, and looking for equitable solutions, this charter advocate, who is pushing for OUSD to share parcel taxes and rent-free facilities with Charter schools that pick and choose who they educate, this advocate says “but what about the test scores?”
What about serving all kids?
Let’s be very clear so there is no question: we believe strongly that OUSD must do better to improve outcomes for kids, and that is especially true for the kids in schools like this District school, who have been underserved for generations. But we must also acknowledge that, for our district schools and the students in them, it matters who (doesn’t) get chosen by charters.