
Last week, Skyline HS Students hosted a candidate forum for District 6, and it was amazing. The students were excellent moderators, asked a variety of important questions and managed the whole evening very professionally, well-done Titans!
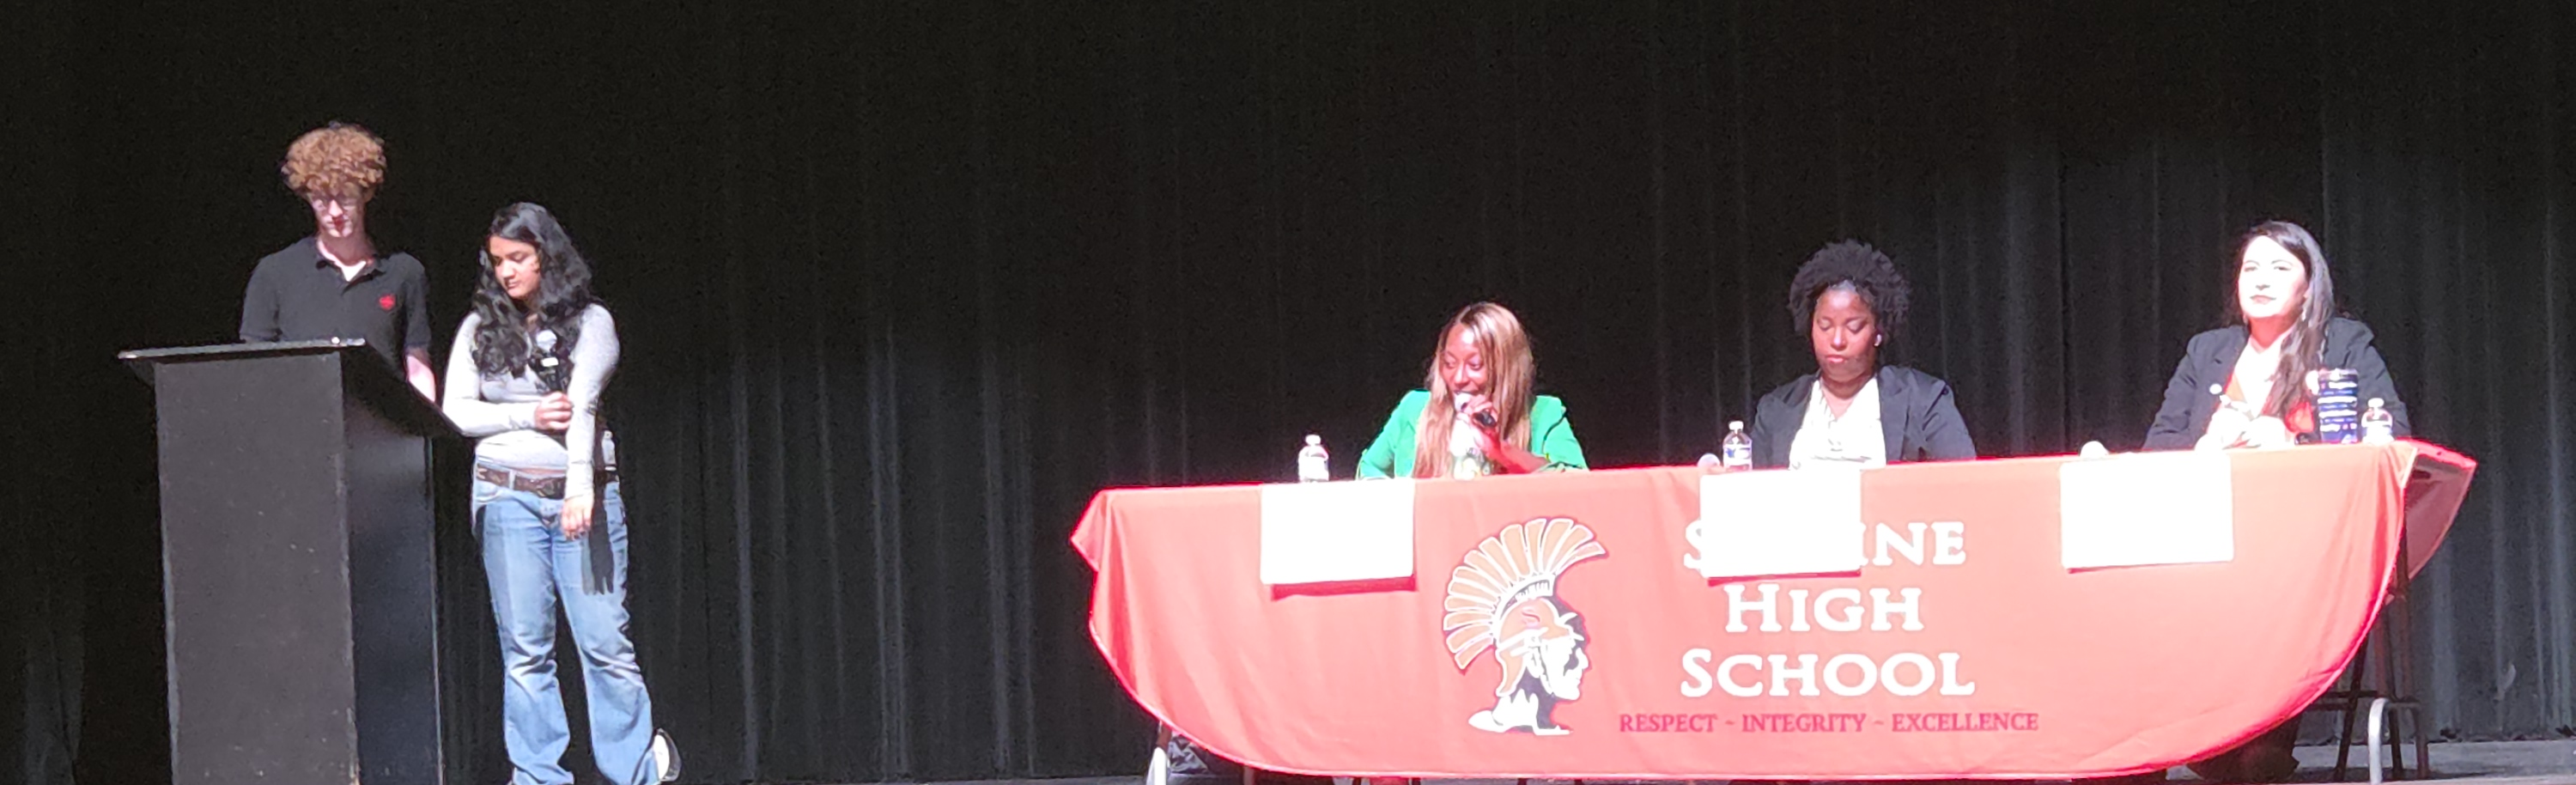
One of the questions for the panel was about school closures, which has been a hot topic in this election cycle. Some candidates and Political Action Committees have renewed calls to close schools to solve the budget crisis (despite no real evidence that it will do so1). Let’s look back at the history of school closures in Oakland for context, to better understand the legal implications of continuing to close “underenrolled” schools in Oakland Unified.
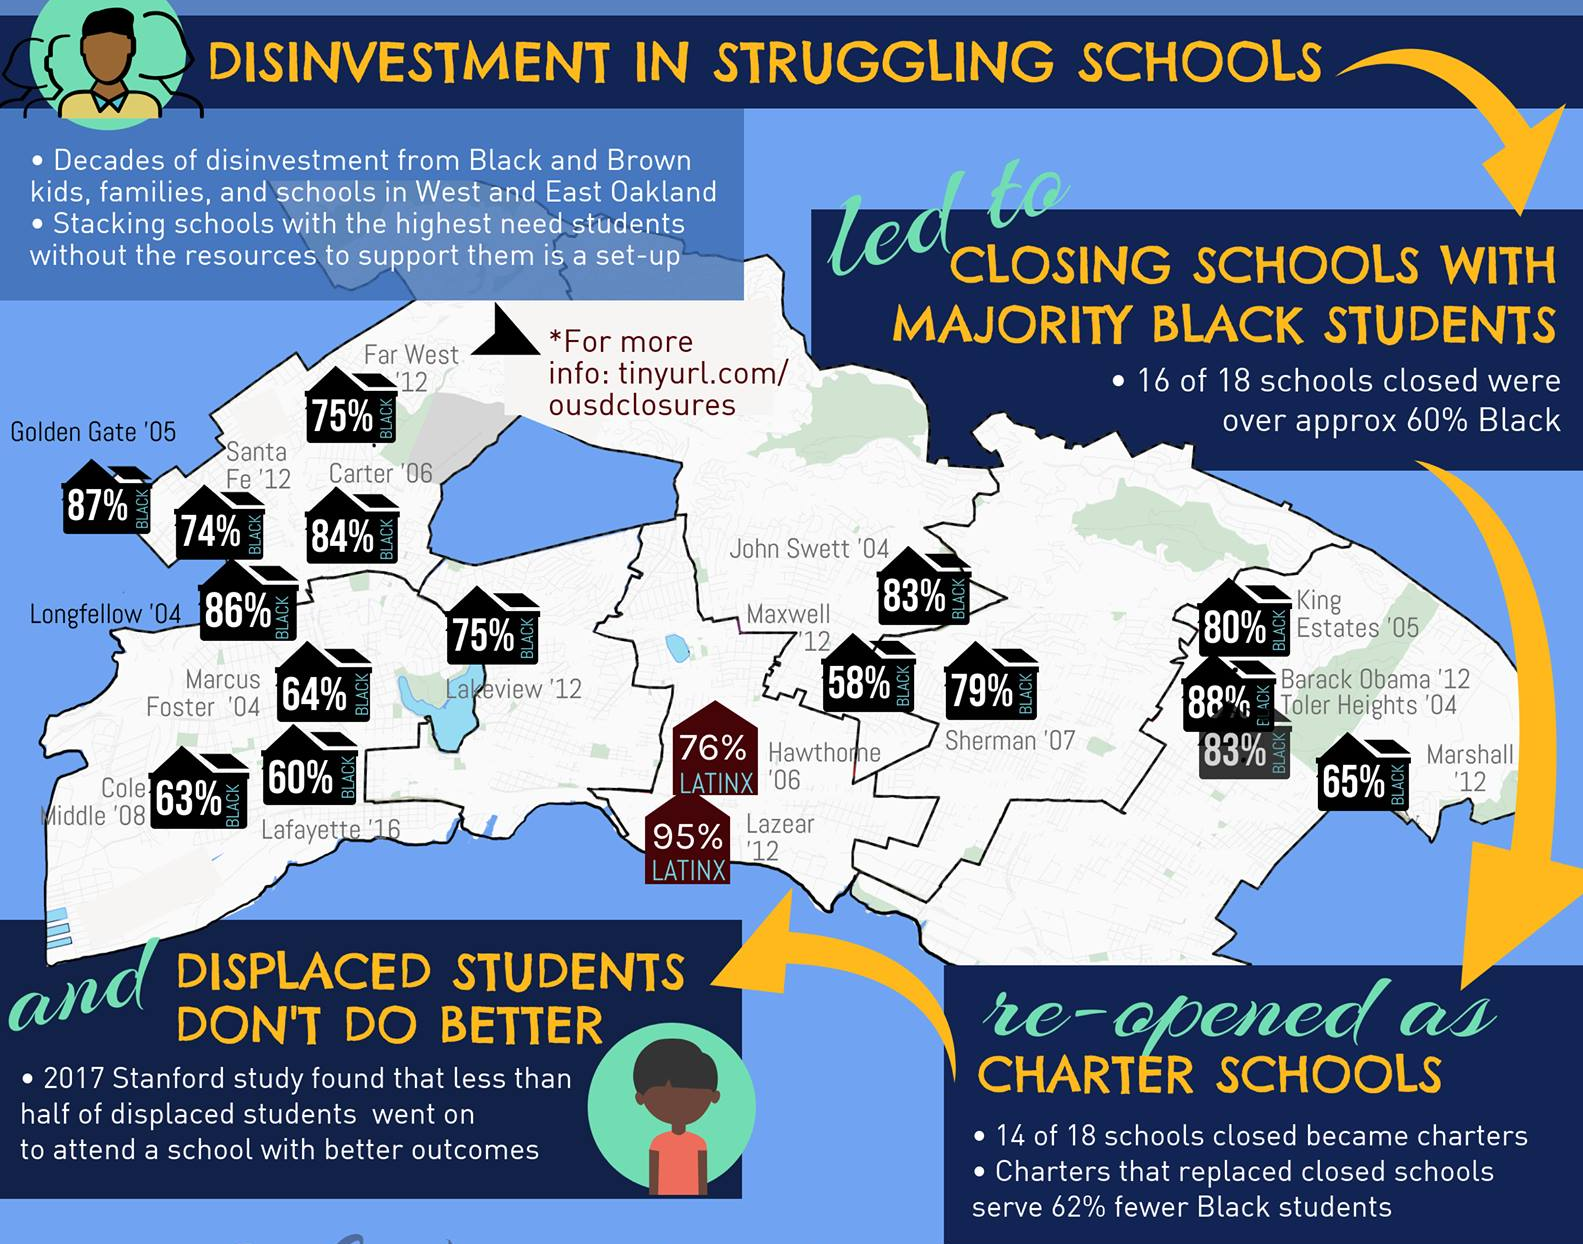
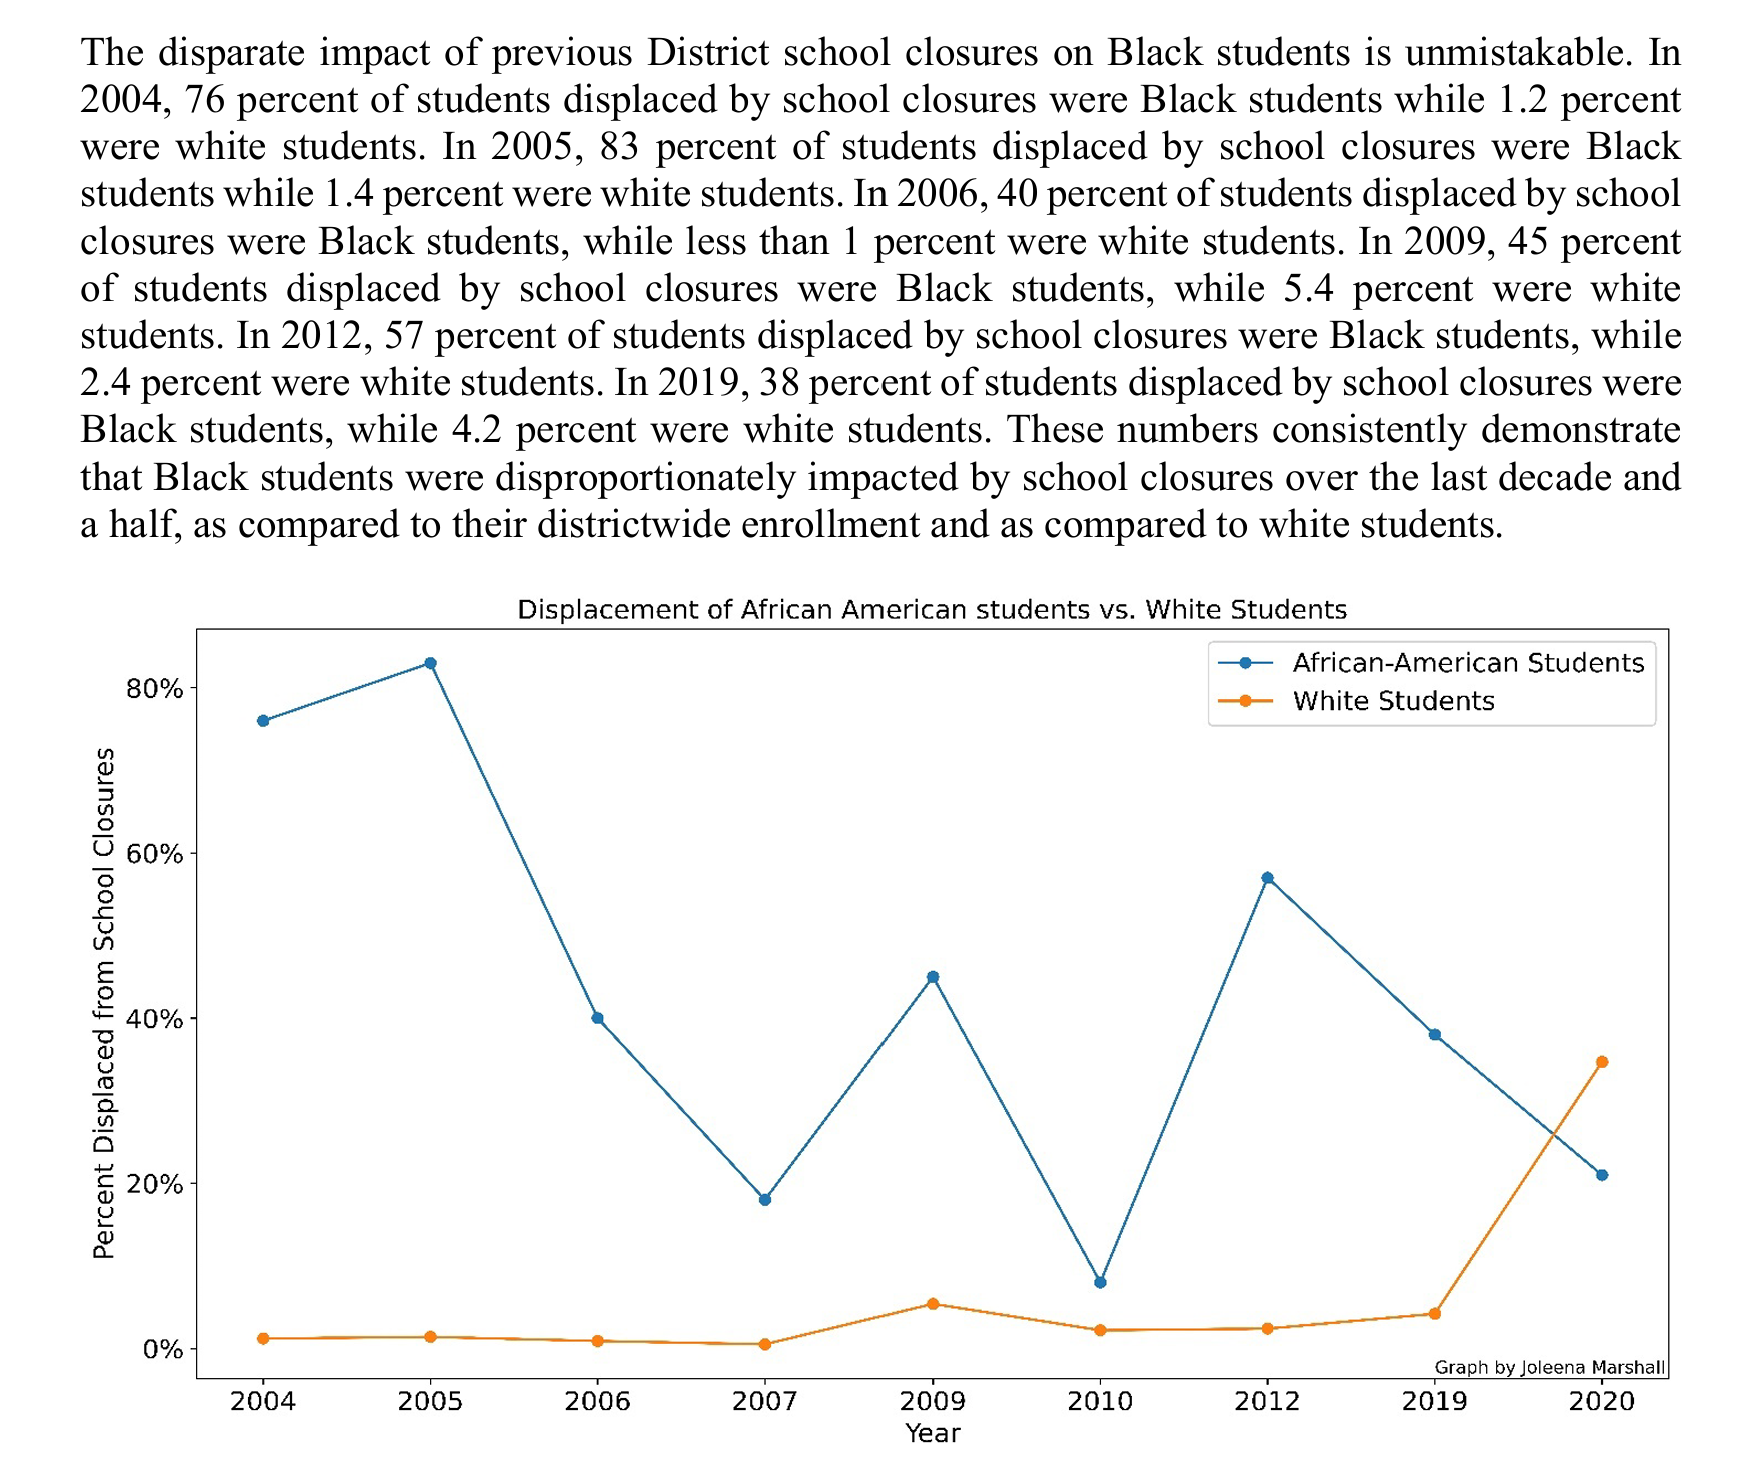
Since 2003 when the state took control of our school district, OUSD has closed 23 school campuses2 (not including creating and closing small schools but leaving the campus open). Of those, 6 are currently vacant and 6 house charter schools3. The remainder have been repurposed for a different OUSD use (admin, preschool, special education, new schools, etc). The vast majority of schools closed have been predominantly Black and have decimated neighborhoods and fueled the gentrification of East and West Oakland. According to a study by Dr Francis Pearman of Stanford “school closures, … are emblematic of a larger spatial and racial reimagining of U.S. cities…, fueled through gentrification and related shifts in local governance, that dispossess and displaces Black neighborhoods.4“
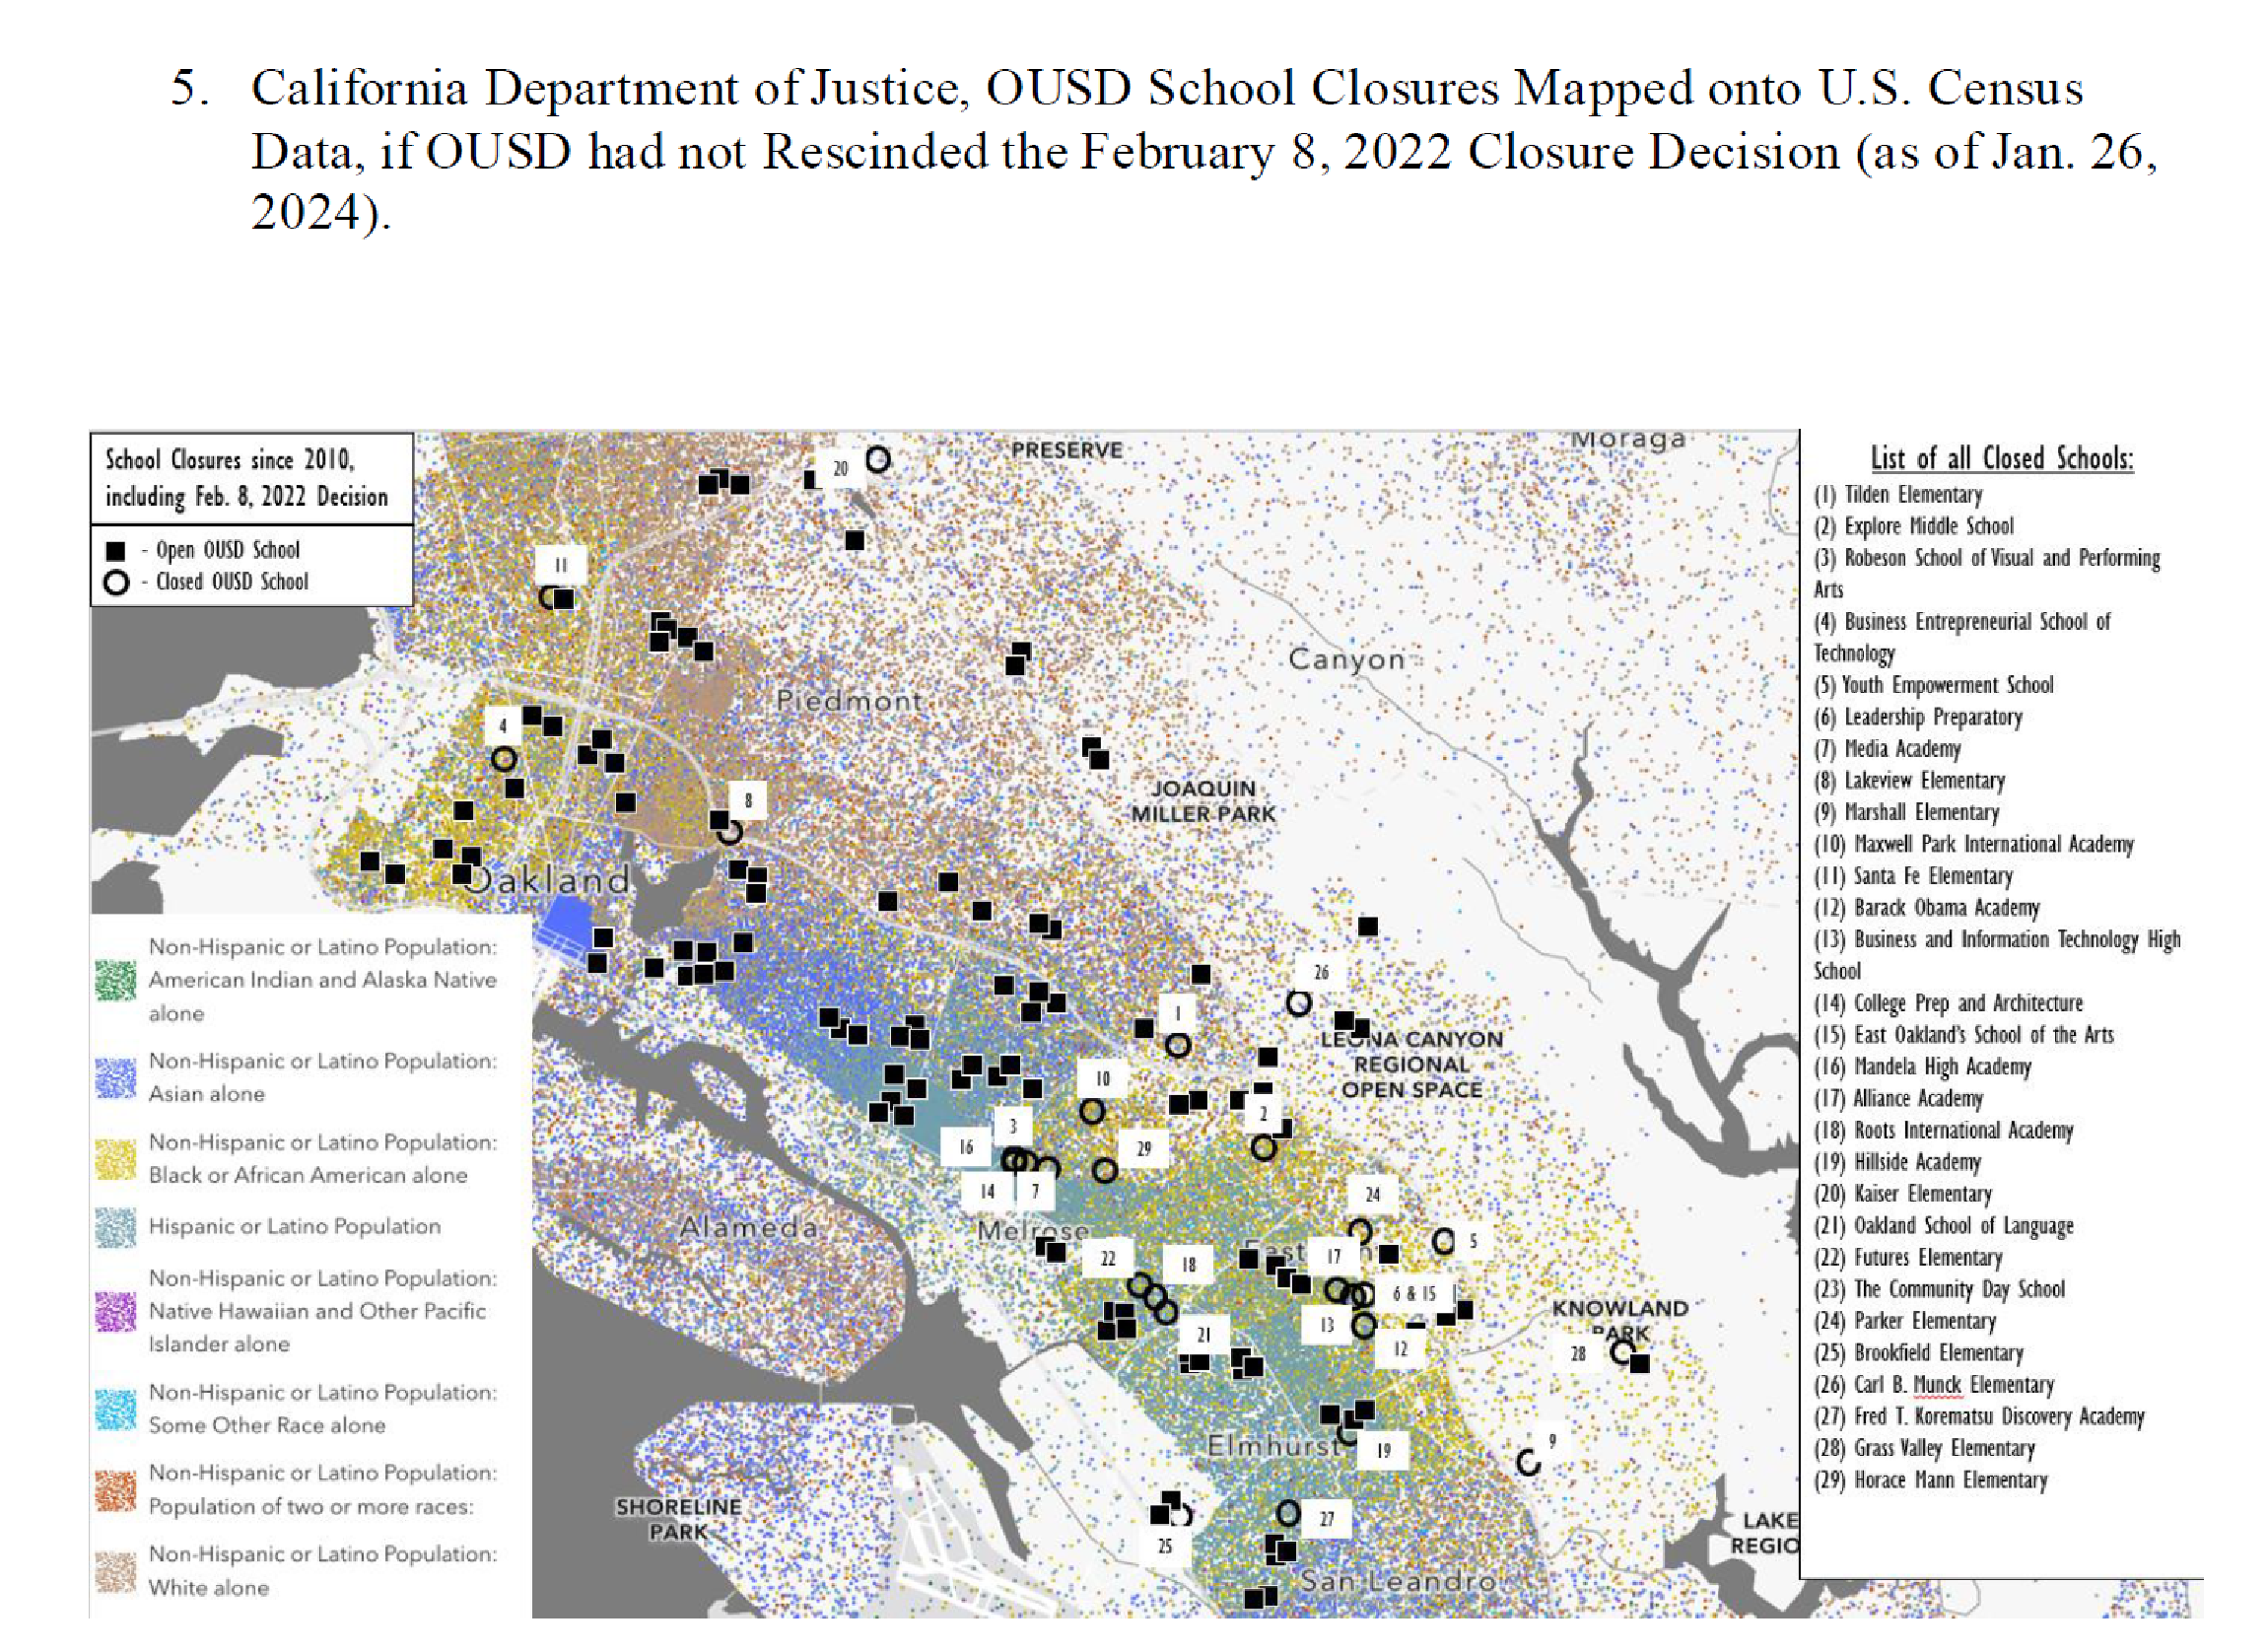
When OUSD voted in a rushed process to close schools in 20225, the Justice for Oakland Students Coalition, of which Parents United is a member, filed a complaint with the California Attorney General’s Bureau of Children’s Justice arguing that as it had historically done, once again OUSD was discriminating against Black students with its school closures plan. The Attorney General agreed6, as did the legislature with the passage of AB 1912 which requires a year long time frame for making any school closure decision and an equity impact analysis to be performed before the decision is made.7
In its letter to the OUSD Board of Education, the Attorney General stated that the “Department’s analysis of public data showed that OUSD’s February 8, 2022 Closure Decision would have disproportionately impacted Black and low-income elementary school students and also high-needs students with disabilities in special day classes, if the decision had not been rescinded.8” In short, any future school closures must look very different from those in the past and not repeat the historic patterns of government sanctioned neighborhood racial segregation. The Attorney General concluded that “(e)ven if the process is conducted in accordance with AB 1912, OUSD must also ensure that the results do not violate California’s Equal Protection Clause or anti-discrimination mandates.”
Fast forward to 2026, what could school closures look like?
During the Skyline student-led forum candidates were asked a question about school closures to which candidate Alexandra Williams responded that OUSD already had a map ready to go and it just needed to be carried out – a reference to a presentation by staff to the Board in October 20249. It feels like a good time to dig out that set of maps to see just what OUSD was proposing post-AB1912 for how a “right-sized” district would look. Spoiler alert – school closures are not just for Black, Brown and Disabled students anymore.
OUSD Optimal School Location Analysis
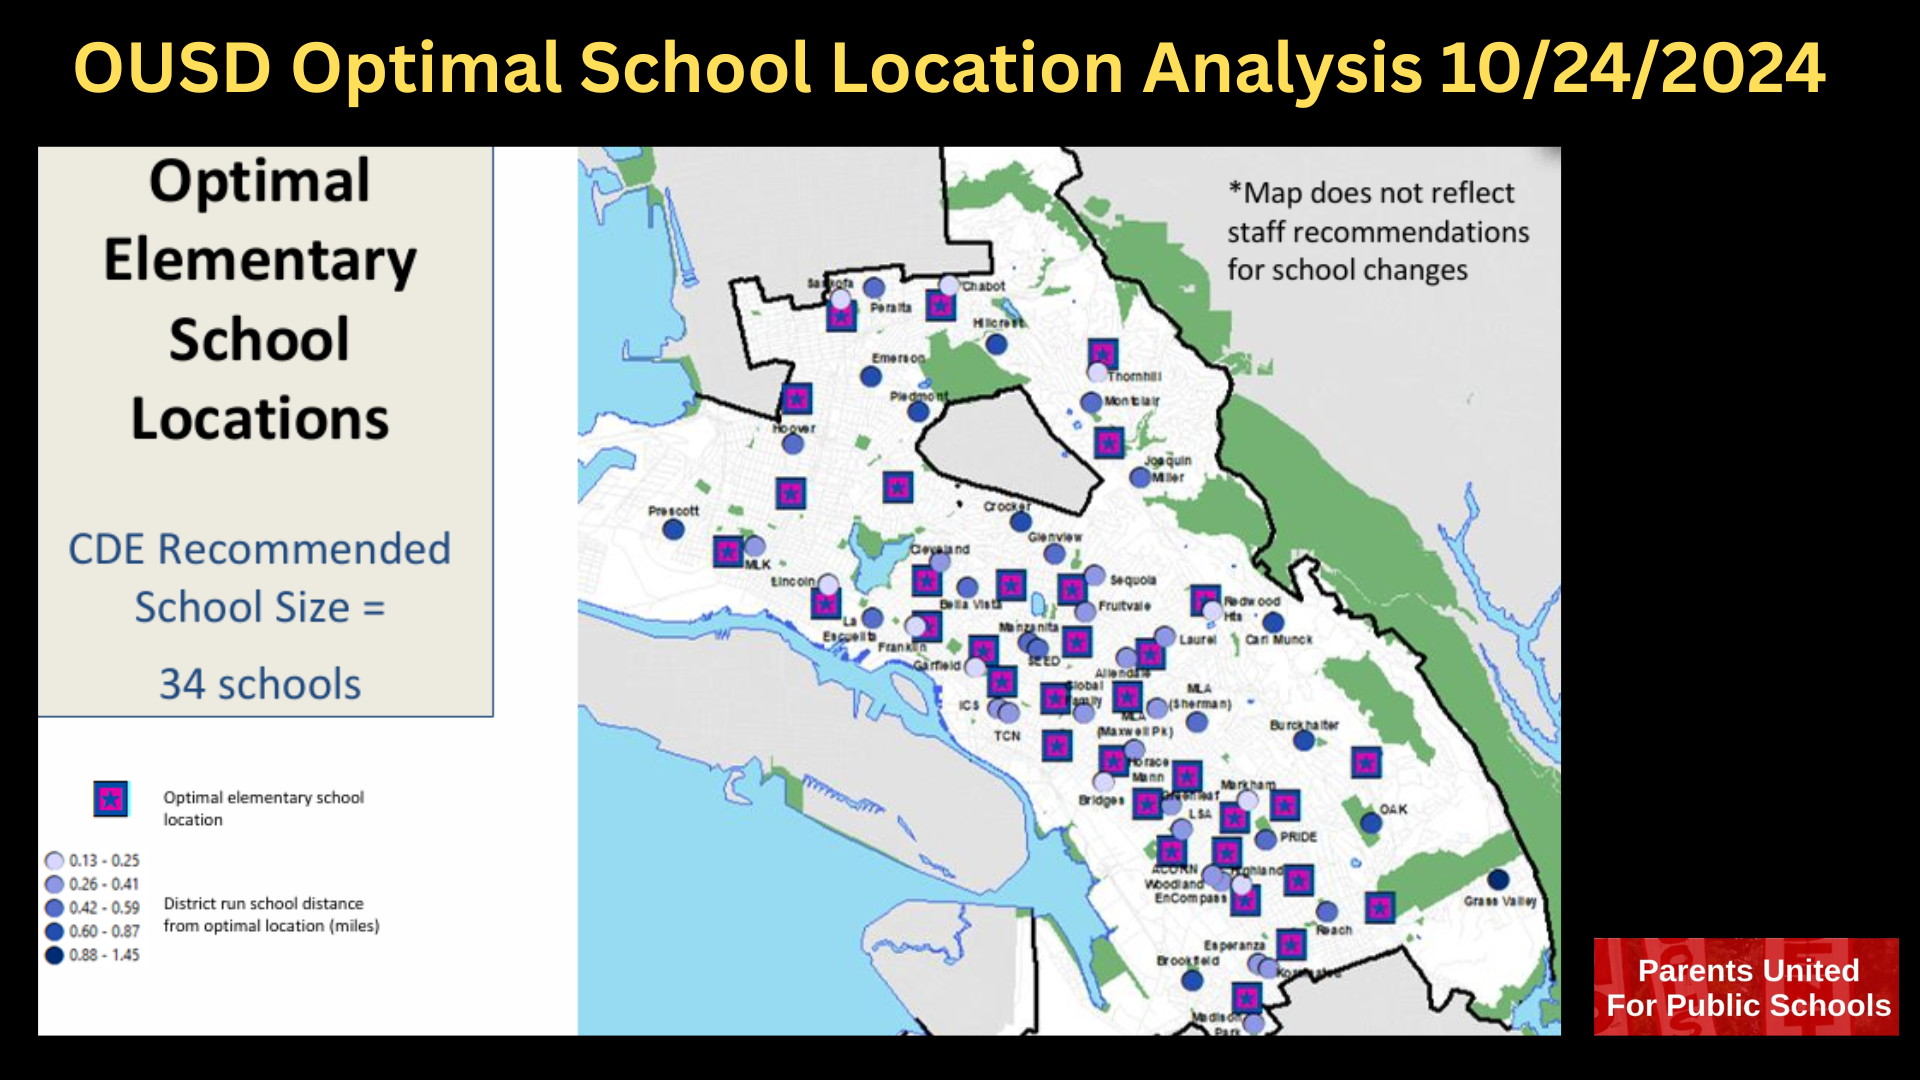
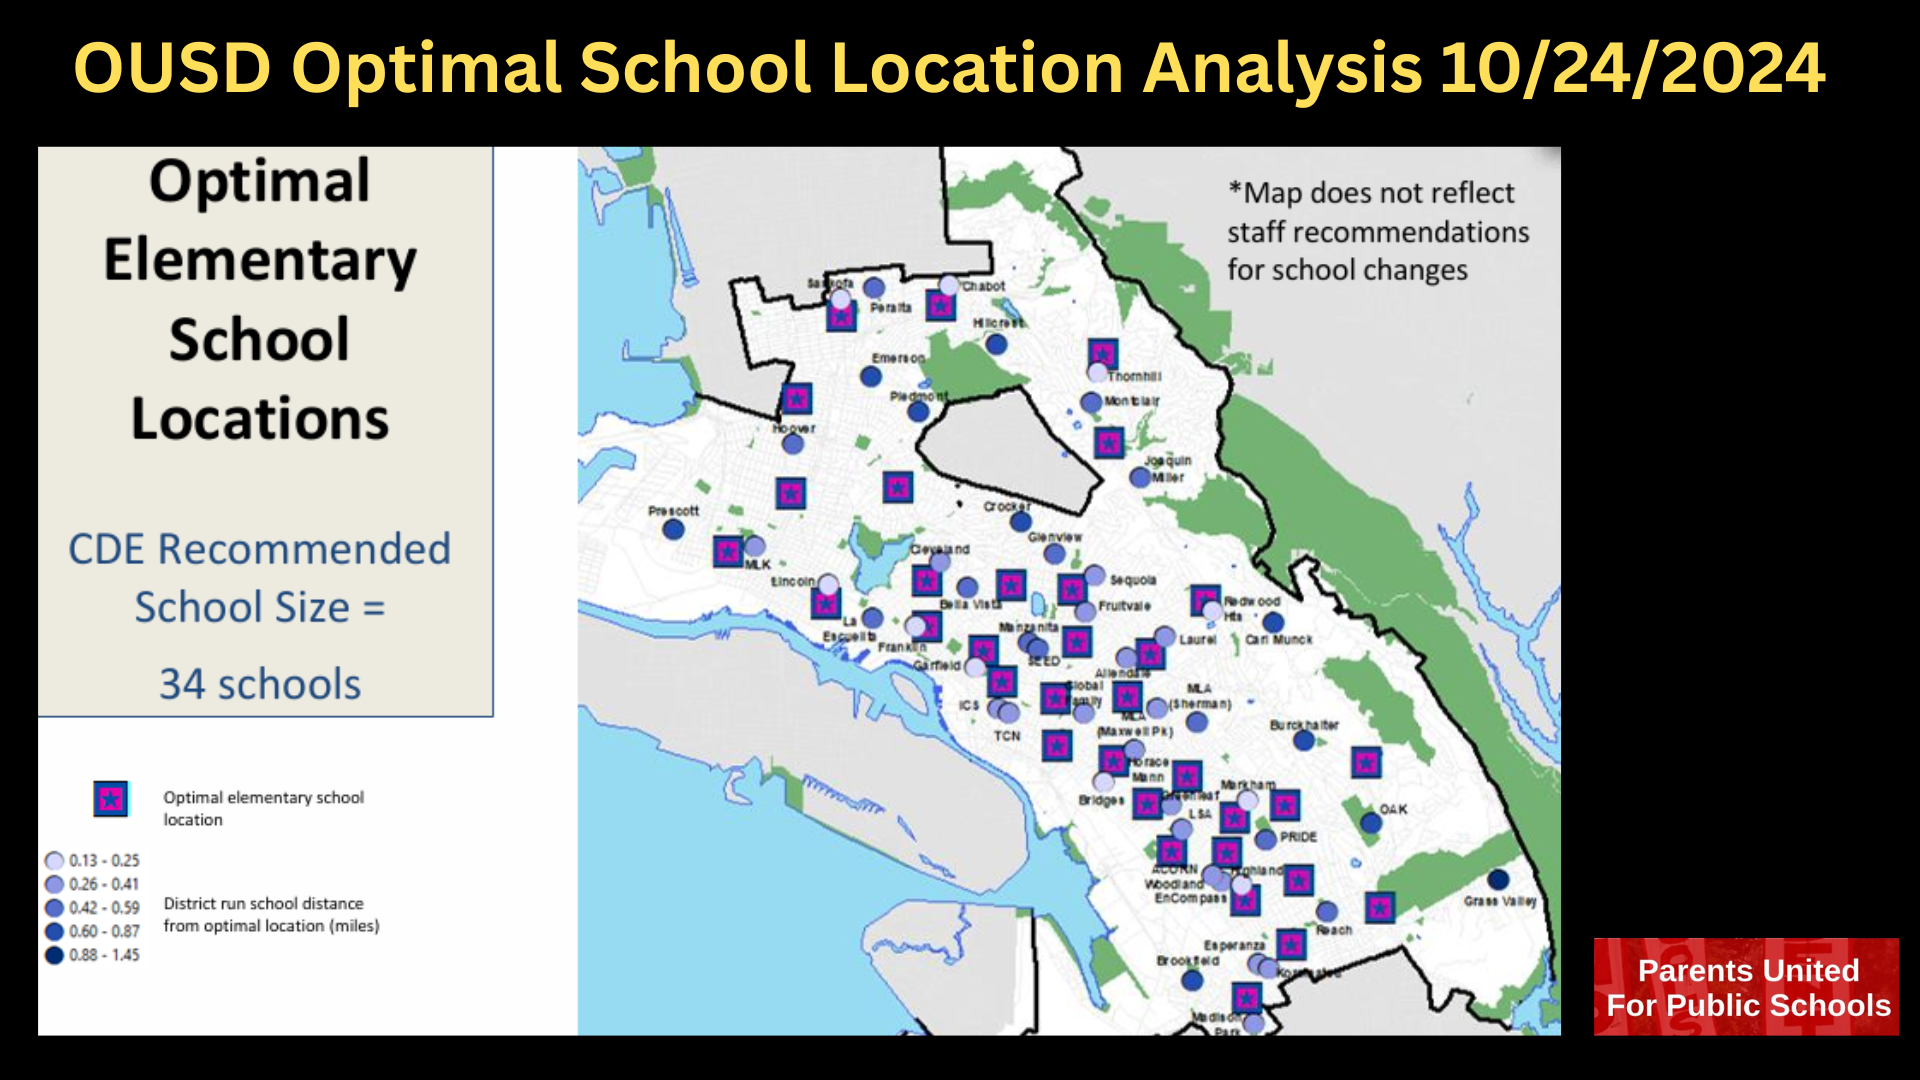
In its presentation, OUSD Staff used an “Optimal School Location Analysis” process “to determine the optimal location of school sites based on the location of students.” In other words, schools will be located closest to where students are concentrated. Although staff claimed that this was not the final recommendation for school closure decisions, a tremendous amount of work no doubt went into the creation of these maps, and as Ms Williams pointed out the maps are ready to go for the next round of closures.
To make the presentation clearer, we have circled the closest schools to each optimal location and placed an “X” on the schools that are not in optimal locations. As you can see from the map, the Optimal Location Analysis projects closing 12 elementary schools and consolidating 8 schools, leaving 34 elementaries total. For middle schools, 10 schools would be closed, leaving 7 middle grade schools across Oakland. Finally, according to the presentation, we need only 5 high schools, meaning we would close 11 schools.
Elementary Schools – 16 fewer schools on 12 fewer campuses10
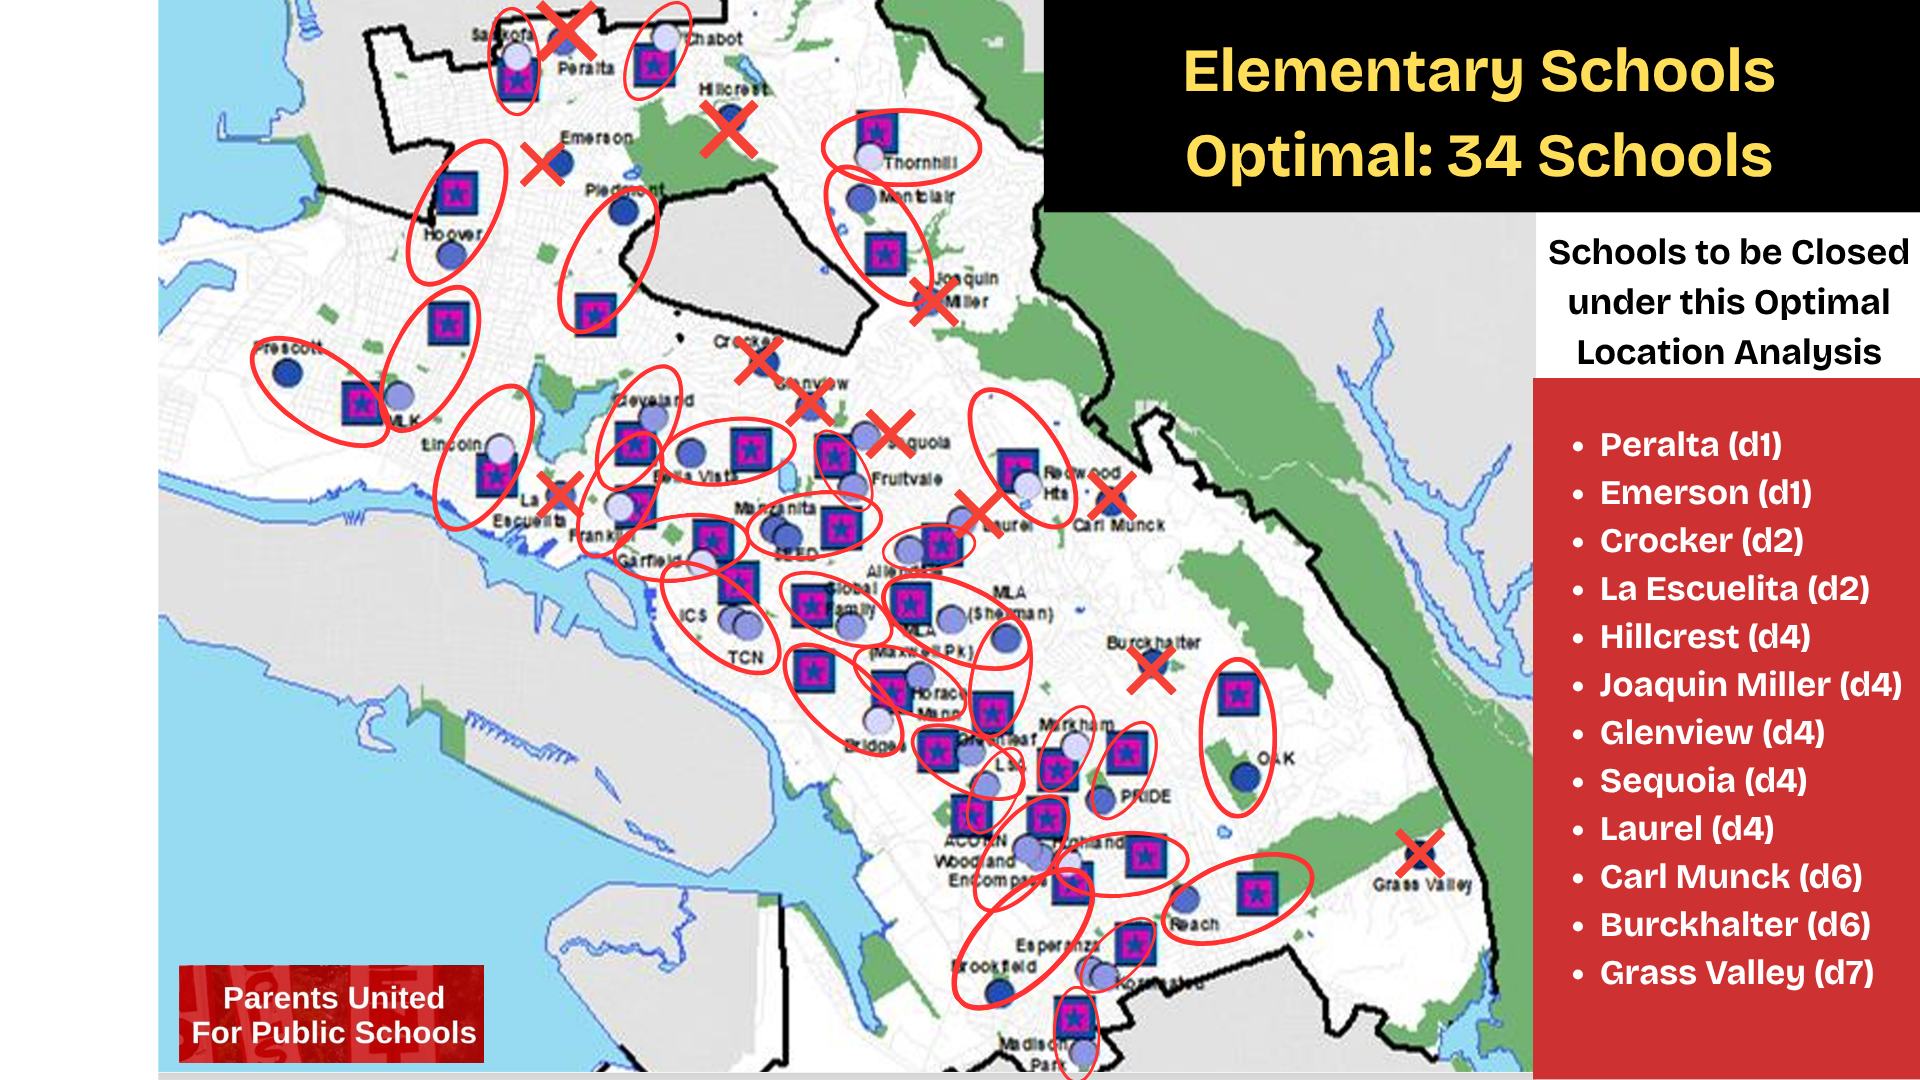
According to OUSD, the “optimal” number of elementary schools in Oakland is 34 schools of 500 students each, which means that 12 schools would be closed and 8 schools would merged or consolidated – those elementary schools that share a campus. Most of these schools were set to merge in 2024, but then-President Sam Davis was unable to even get the plan forward for a vote11. Under this “Optimal Location” map, five District 4 schools would be closed, something that has not happened before, at least in the last 25 years. 27% of the impacted students identify as white students, compared to 21% African-American students. 58% low-income12, and 19% students are Disabled, which is higher than OUSD’s overall average of 18.1% and also higher than the average of those schools identified for closure in 202213. In the 2022 school closures that the Attorney General found violated California Civil Rights Laws, 41% of impacted students were Black, while just 2.2% were white, 15.72% were Disabled and 81% were low-income.
Middle Schools – 10 fewer Schools
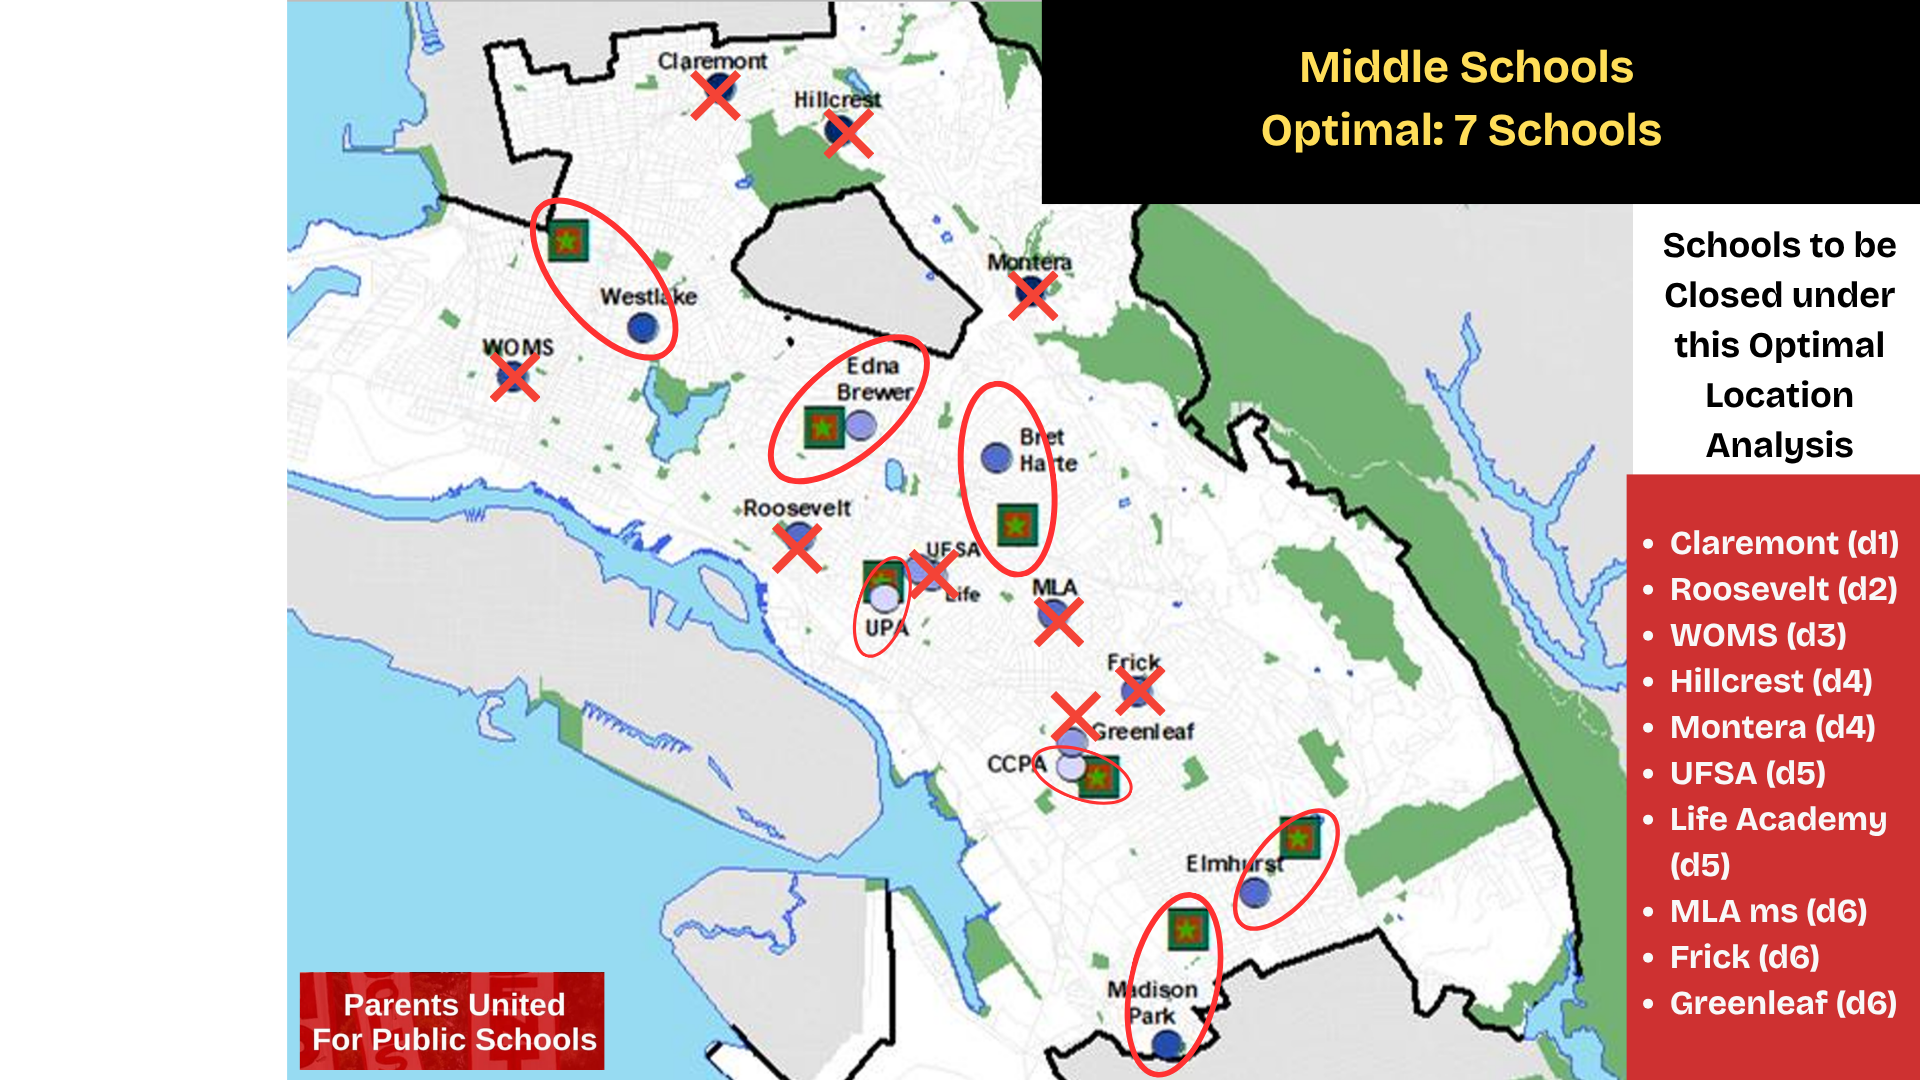
Under the Optimal Location analysis, OUSD would only need 7 middle schools of 1,000 each, resulting in the closure of 10 middle schools. We know that many white families leave the district at the middle school level, so overall there are slightly fewer white students at 10% and 18% African-American students. Under this closure plan, 13% of impacted students are white, 14% Black, 79% of the students are low-income and 15.9% Disabled. District 6 would be most impacted by this plan.
High School – 11 fewer schools
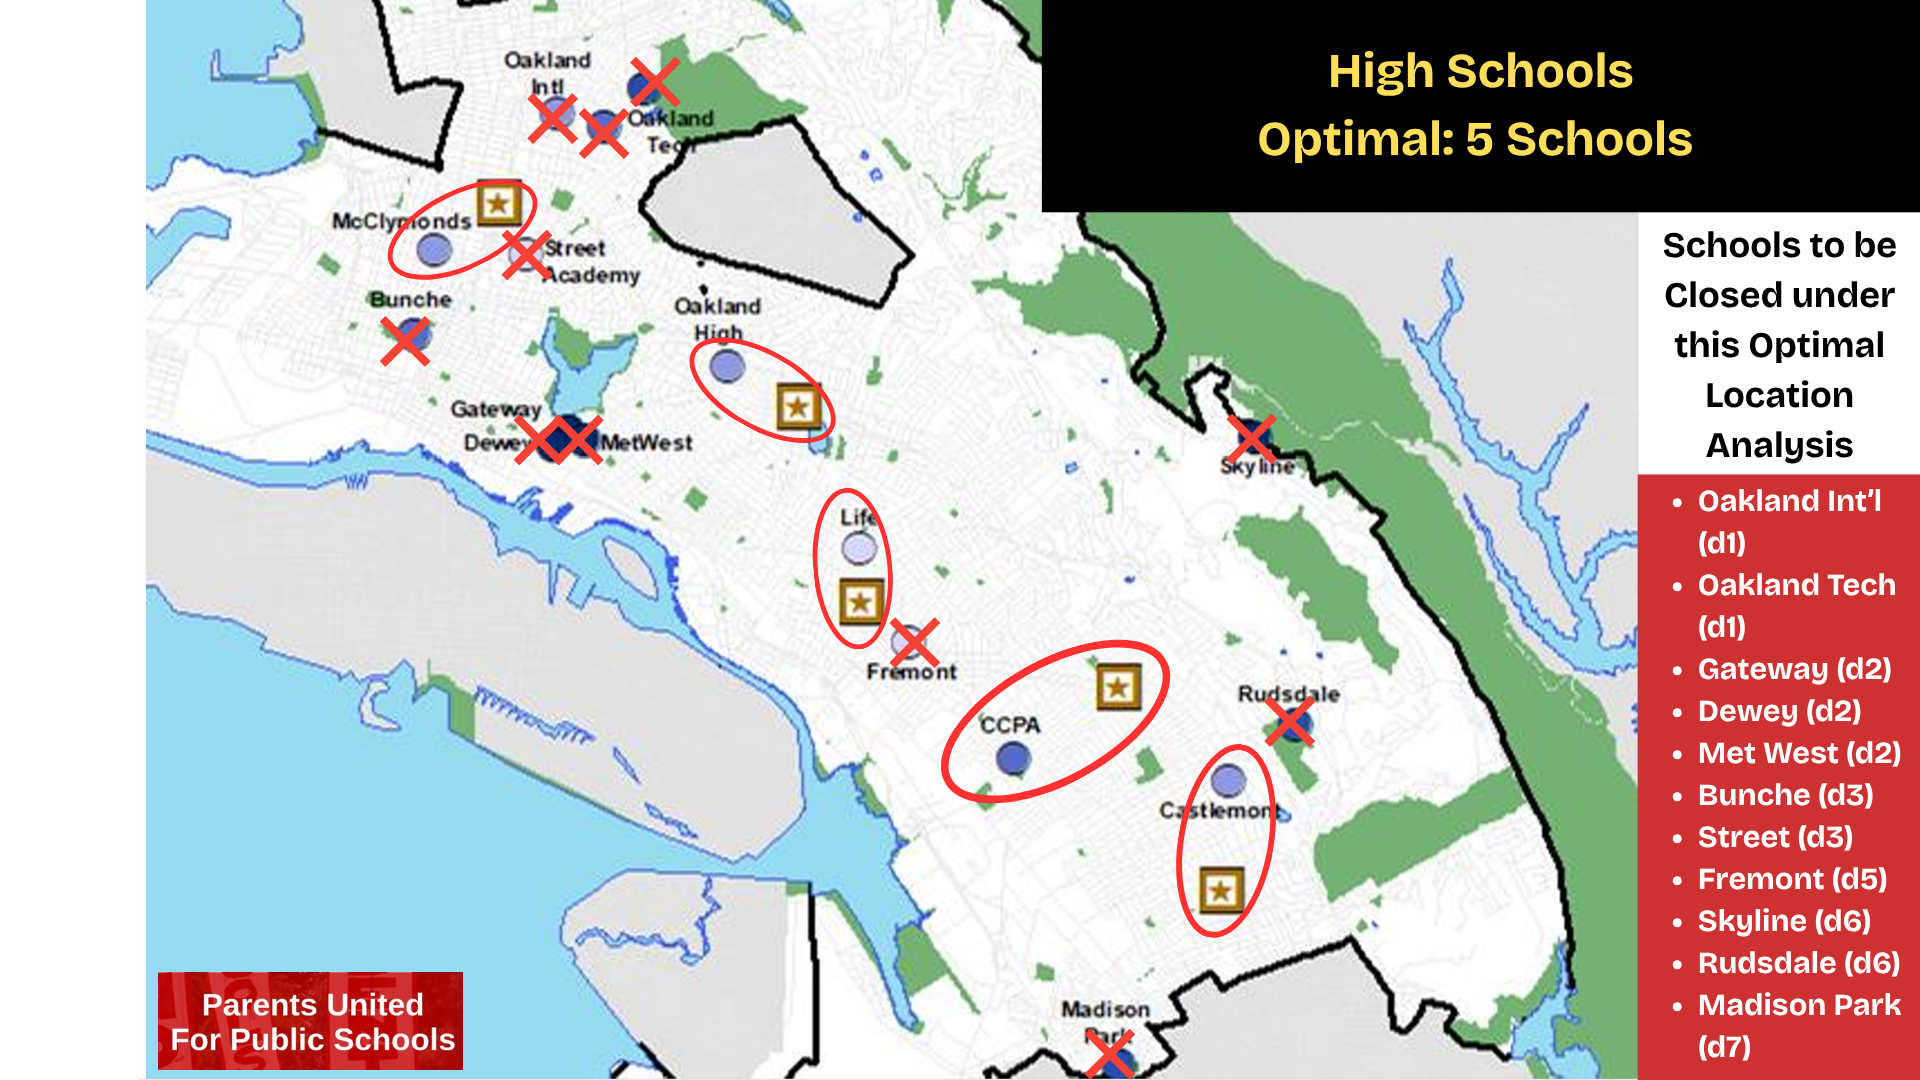
Under the Optimal Location Analysis, OUSD would need only 5 high schools of 2,000 students each, so would close 11 schools. Students impacted by these closures are 6.3% white, 16.5% Black, 15.5% Disabled and 92% low-income, with most schools in District 2.
Contrary to candidate Alexandra Williams’ statement that the closure plan is ready to go, clearly adjustments would need to be made to these maps in order to make even the slightest bit of sense. For instance, Glenview, Fremont and Madison Park have all recently been refurbished at great cost to tax payers and work at Roosevelt is underway. Closing those schools would rightly be considered a huge waste of taxpayer resources. Also, and perhaps most glaringly, OUSD does not have enough capacity in the schools that would remain open to absorb students from the 37 schools that would be closed.
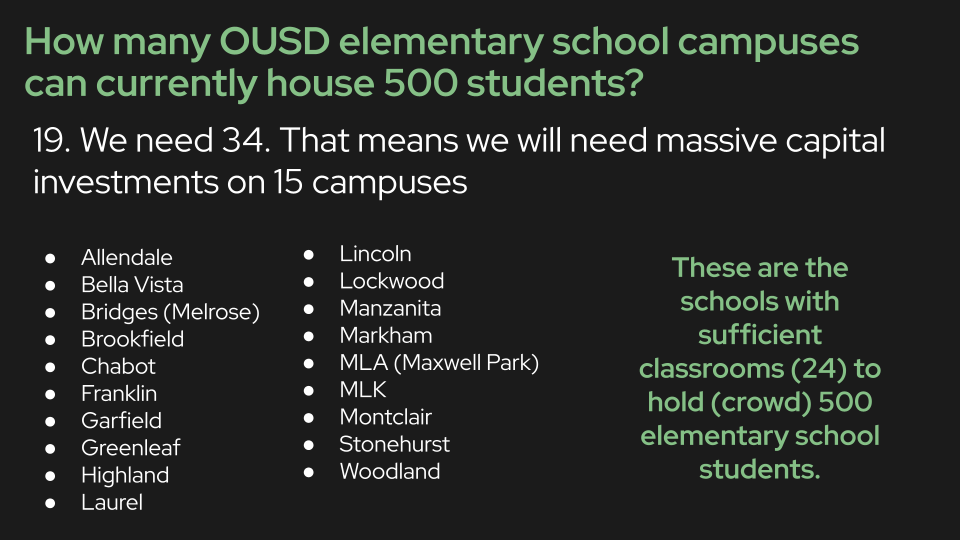
OUSD would also need to decide what they were going to do with the closed schools (or end up with a bunch of charter schools in those buildings) in order to eliminate the cost of maintaining them. Parents United is not advocating that OUSD adopt this plan, or any school closure plan, but it is important to understand what such a plan might look like as groups like “Oakland Parents for Quality Education” and “Empower Oakland” push for school closures. While there are some parents at the more affluent schools represented by these groups who are willing to close their own school, as we saw during the closure of Kaiser, many/most of the white and affluent parents are likely to flee the district, resulting in massive loss of enrollment and therefore little to no savings achieved.
- Closing schools may not improve districts’ financial standing, Stanford study finds | Stanford Graduate School of Education ↩︎
- https://www.cde.ca.gov/SchoolDirectory/report?rid=dl1&tp=xlsx&ict=Y; includes on k-12 schools ↩︎
- Several charter schools occupied closed OUSD schools until very recently, including Aspire Berkeley Maynard (closed), Francophone (moved), Bay Tech (moved), Community School for Creative Education (closed), Urban Montessori (closed). ↩︎
- School Closures and the Gentrification of the Black Metropolis ↩︎
- Seven OUSD schools to close, one spared; board votes despite pleas from children – Oakland North ↩︎
- Attorney General Bonta Advises Oakland Unified to Comply with State Laws as It Considers Whether to Close, Merge, and Consolidate Schools in 2025-2026 | State of California – Department of Justice – Office of the Attorney General ↩︎
- Bill Text: CA AB1912 | 2021-2022 | Regular Session | Chaptered | LegiScan AB 1912 no longer applies to OUSD because our state loan is paid off, but AG Rob Bonta made clear in a statewide guidance letter that Districts not subject to AB 1912 should follow the mandates in AB 1912 to avoid running afoul of California Civil Rights Laws and the Constitution. Guidance Regarding Laws Governing School Closures and Best Practices for Implementation in California ↩︎
- CalDOJ.LettertoOaklandUnifedRePotentialClosures.1.29.24.final_.pdf; The OUSD Board (after the election of Directors Bachelor and Brouhard) voted to rescind the remaining closures for 2023 on January 11, 2023 ↩︎
- https://ousd.legistar.com/gateway.aspx?M=F&ID=113621.pptx ↩︎
- This is based on an optimal enrollment of 500 students for elementary, 1,000 for middle schools and 2,000 for high schools. Note that this is purportedly based on CDE suggestions, which is a misuse of CDE data. Those CDE numbers are for NEW construction, not ideal school size, and ignores the fact that most of our existing schools do not have the capacity required to meet these requirements. ↩︎
- https://ousd.legistar.com/gateway.aspx?m=l&id=/matter.aspx?key=63955 ↩︎
- Low-income is measured by the number of students who qualify for Free or Reduced Price lunch; data drawn from the OUSD schools site funding profile for 26-27 https://docs.google.com/spreadsheets/d/1nfTaIf4ArSh54_g7uTFg1Yc1N3LKUofMGJzPqwV9iKY/edit?usp=sharing ↩︎
- In the AG opinion, they focus specifically on Disabled students in special day classes; that data is not as easily available so more information is needed to make a good comparison. ↩︎

